Most precious metals holders start with a Google Sheet. A row per purchase, a column for the dealer, another for what was paid. By the time you hold forty coins from five different dealers across three metals — and a couple of pieces have been sold — the sheet has quietly stopped being reliable. The totals look plausible until you check them, and the cost basis on the items you sold last spring is anyone’s guess.
This guide covers what to track for every coin and bar, why a spreadsheet eventually breaks down, and what a purpose-built tool does that a spreadsheet cannot. We use Gold Silver Ledger — the portfolio tracker we built — as the worked example for the tracker sections.
What “tracking a precious metals portfolio” actually means
Tracking a precious metals portfolio means maintaining an item-level inventory of every coin, bar, and round you hold, recording what you paid (including the premium above melt), pricing it against current spot, and keeping disposal records ready when you sell. It is not the same as watching the spot price.
The spot ticker scrolling across a financial dashboard tells you what an ounce of metal is worth at this moment. Tracking tells you what your holdings are worth, what they cost, and how the gap between those two numbers has moved since you bought each piece. Spot is one input. The other inputs are the records you keep.
Tracking is also not accounting in the formal sense. It is the raw input that an accounting workflow — an annual tax return, a 1099-B reconciliation, an insurance schedule — eventually pulls from. The point of a tracker is to capture that raw input cleanly enough, at the moment of each transaction, that none of the downstream work requires guessing.
What to record for every coin and bar
Every piece in the portfolio belongs on a single row in your records. Four families of information go on that row. The list below is the field-level checklist a serious tracker needs, regardless of the tool you choose to keep it in.
Product identity
This is what the piece IS — the data that would let any future reader (you in three years, a spouse, an insurer, an heir) identify the coin or bar without holding it in their hand. The fields are simple, but skipping any one of them makes a row much harder to use later.
- Product name: “American Gold Eagle 1 oz,” “PAMP Suisse 10 oz silver bar,” “pre-1965 Washington quarter.”
- Metal: Gold, silver, platinum, or palladium.
- Form: Coin, bar, round, or junk.
- Weight: In troy ounces — the global precious-metals convention. (See: troy ounce)
- Fine weight: The actual mass of pure metal, after purity.
- Purity: .9999, .999, .9167, .90 — written as a decimal fineness.
Purchase context
This is when the piece arrived and where it came from. These fields are what tie a row back to a receipt, an invoice, or a memory.
- Purchase date: Locks the tax-clock for the piece and locks the spot price that applied at the moment of purchase.
- Dealer or source: APMEX, JM Bullion, Money Metals, a local coin shop, or a private sale.
- Transaction reference: An order number, an invoice ID, or whatever hook makes the row findable next to the paper trail.
Cost components
This is the pair of fields most spreadsheets compress into one — and the compression is where cost basis gets fuzzy. Melt value moves with spot every minute, but the premium your dealer charged is a fixed dollar number paid on a specific day. Record them separately, and the cost basis stays structurally clean.
- Spot price at the moment of purchase, in USD per troy ounce.
- Premium-over-spot per unit, in dollars — not as a percentage. (Percentages drift; the dollar premium does not. See: premium over spot.)
- Per-unit purchase price, which can be derived from spot + premium or recorded directly.
- Shipping and handling, allocated to this purchase.
Personal identifiers
These are the optional hooks that make a row searchable later. They are not strictly required for cost basis, but a few of them turn an inventory from a wall of numbers into something you can actually navigate.
- Nickname: “Grandma’s Eagle,” “birthday coin,” “the bent Maple.”
- Personal reference: A serial number on a bar, an invoice ID, or a personal SKU.
- Mint year: A 2019 American Gold Eagle and a 2025 American Gold Eagle share the same product line, but the year on YOUR specific coin matters for resale and for matching it back to the receipt.
Why spreadsheets eventually break down
A spreadsheet is a perfectly reasonable starting point. The problem is what it cannot do, structurally, once the portfolio grows. Four failure modes show up in roughly this order — most have hit at least two by the time they reach forty or fifty pieces.
They can’t price your holdings live
Spot prices move minute to minute. A spreadsheet’s options are to paste a fresh spot value manually whenever you check (and forget the next day), to wire in a live-price formula that breaks every time the symbol changes, or to accept that the current-value column is always wrong. Most settle for the third option and stop trusting the totals.
Premium-over-spot gets buried
Most spreadsheets record a single “price paid” cell per row. That is enough to compute cost basis on paper, but it loses the split between melt and premium — and the premium-over-spot number is what every serious investor actually wants to track over time.
Without separate spot and premium columns, you cannot see whether your average premium has crept up across years, whether one dealer charges more than another, or whether you are paying snippet-trap premiums on fractional silver.
Sales-side cost basis is unworkable
When you sell five out of twenty Silver Eagles, the IRS allows Specific Identification — picking the exact pieces sold so the cost basis is the cost of those specific pieces, not an average. A spreadsheet can fake this with manual matching, but the manual matching gets harder every year, breaks on partial fills, and rarely survives a multi-account split.
Tax software that downloads a 1099-B does not help much either; coin dealers generally do not issue a 1099-B for under-threshold sales (a topic with its own guide on when dealers are required to report).
Cross-currency math creeps in
If you ever buy in USD and live in another currency — or watch spot in USD and want your portfolio totals in CAD or GBP — a spreadsheet starts needing a second FX column on every row, plus a way to keep historical FX rates from drifting silently as global rates move.
Most give up and pick one currency to live in, then under-report whenever they actually transact in the other.
What a purpose-built tracker does differently
The four problems above are not solvable inside a spreadsheet. They need a tool that is built around them. Gold Silver Ledger is the portfolio tracker we built specifically for physical precious metals, and the four structural choices below shape how every screen in it works.
Every coin and every bar is its own record
Buy ten American Silver Eagles in one transaction, and the ledger creates ten separate inventory items — not one row with a quantity of ten. Item-level inventory is the foundation that lets you pick the exact pieces you sold for
Specific Identification cost basis, attach a per-piece nickname or serial number, and compute days-held correctly on each individual coin when it eventually leaves your collection.
Spot at the moment of purchase is locked on the record
When a transaction is recorded, the live spot price at that moment is captured and frozen on the row. Live spot only drives the current-value side of the math.
That keeps the historical “premium paid” number on every purchase accurate years later, no matter how far spot has moved.
For backdated purchases — an invoice from 2019, a stack of receipts from a coin show several years ago — you override the auto-filled current spot with the historical spot for that date.
Premium-over-spot is a first-class field on every row
The Record Purchase form asks for premium per unit in dollars, not for the total price paid. Cost basis becomes melt + premium structurally — no derived columns, no formula drift, no rounding error introduced by a stale spot reference.
Premium shows up on every holding, on the dashboard totals, and on the Premium Analysis card inside the Analytics page.
USD storage, your currency at display
Every monetary value is stored internally in USD. You pick a display currency — fifteen are supported, covering most of the Americas, Europe, Asia Pacific, and South Africa — and the ledger converts at render time.
Changing display currency never alters the underlying record. The result is one purchase, one true cost, every value rendered cleanly in whichever currency you actually think in.
Spreadsheet vs. purpose-built tracker, at a glance
The same four problems and four structural choices, side by side.
| What you need | Spreadsheet | Purpose-built tracker |
|---|---|---|
| Live current value | Manual paste, formula hack, or accept it’s stale | Updates continuously against live spot |
| Premium-paid history | Buried inside a single price-paid cell | First-class field on every row |
| Specific-ID on sales | Manual matching, breaks on partial fills | Pick the exact pieces sold; days-held per piece |
| Multi-currency display | A second FX column per row, kept current by hand | USD stored, display currency converted at render |
| Item-level history | One row per purchase, qty in a cell | One record per physical piece |
How to record a purchase
The Record Purchase form has two halves and is worth a one-pass walkthrough, so the first entry goes in cleanly.
Transaction Details
The top half applies to the whole purchase: Portfolio, Purchase Date (defaults to today; change it for backdated invoices), an optional Transaction Name, Dealer or Source (searchable — add a new dealer inline the first time), Notes (free text), and Shipping & Handling. The shipping is entered once as a single total for the order, and the form allocates it proportionally across every line item by cost.
Items
The bottom half is one line per product. Each line has a product picker (search the built-in catalog or create a custom item on the fly), Quantity, Premium per Unit in dollars, and the Spot Price that applied at the moment of purchase.
Spot auto-fills with current live spot when you pick a product; override it with the historical spot from the receipt for a backdated entry. Add lines with “+ Add Another Item.“
One mistake almost every new user makes: typing the total price into the Premium per Unit field instead of the actual premium. The live Total Cost strip at the bottom of the form looks roughly double what the purchase actually was — the easiest signal to catch it before submitting.
How to record a sale (and why Specific Identification matters)
Selling is a two-step form. Step one is item selection: the ledger lists held inventory one row per individual coin or bar — not per product — and you tick the exact pieces that left your possession. A selected-items strip at the bottom shows the running total cost basis, current value, and unrealized gain or loss on the ticked rows.
Step two captures the sale itself: Sale Date, optional Dealer or Transaction Name, optional Notes, and a per-item Sale Price input. Realized gain or loss appears live under each input. After you submit, the selected items move from Held to Sold (they are not deleted — the records remain searchable on the Sold tab in Holdings), and the Dashboard, Analytics, and Annual Report all update.
Specific Identification matters most at tax time. The IRS rule for collectibles allows you to identify the exact pieces sold, so the cost basis on the return is the cost of those specific coins, not an average across the portfolio. Two consequences follow.
Short-term versus long-term turns on days-held per piece, so picking pieces you bought more than a year ago can be the difference between a 28% collectibles rate and ordinary-income treatment. And the realized gain or loss on the return changes meaningfully depending on which specific coins you say were sold. The cost-basis guide and the capital-gains article cover the mechanics in detail.
Seeing your holdings — three views of the same inventory
The Holdings page is where item-level inventory turns from an abstract idea into a screen you can recognize. The same underlying data appears in three views, and the toggle between them is the icon set at the top-right of the page. All three views share the same Held / Sold / All tabs and the same filter and search controls.
Group view
The default. Two layers of grouping — metal at the top (Gold, Silver, Platinum, Palladium), then product inside each metal, then individual items inside each product. Each layer shows count, total weight, current value, and gain/loss. Useful for the quick “how am I doing per metal” read on a Monday morning.
Item view
A flat, sortable product list — one row per product, no metal grouping. Sortable on every column. The view to use when you want to scan everything in one place, or sort by current value, or by gain/loss percentage, or by purchase date. Has its own Dense toggle and rows-per-page pagination.
Card view
A grid of cards, one per individual physical piece, with the product thumbnail front and center. The “wall of bullion” view — useful for identifying pieces by sight, for spot-checking a count, and for inspecting individual items at a glance. A pencil icon on each card opens an Edit Labels modal.
Labels, filters, and search
Each individual item supports three optional free-text labels: a Nickname (“Grandma’s Eagle,” “birthday coin”), a personal Reference (a bar serial number, an invoice ID, a personal SKU), and a Mint Year annotation (catalog entries are year-agnostic by design, so the specific year on your coin is captured here).
All three are search-indexed and work across every view. Above the views, the Holdings page also exposes filter dropdowns for metal and form, a weight range, a purchase-date range, and a free-text search that matches product names, nicknames, and references.
Reading your performance
Three screens turn the inventory into numbers you can actually use. Each one answers a different question and lives at a different cadence — the Dashboard is glanceable, the Analytics page rewards a longer look, and the Annual Report is once-a-year tax work.
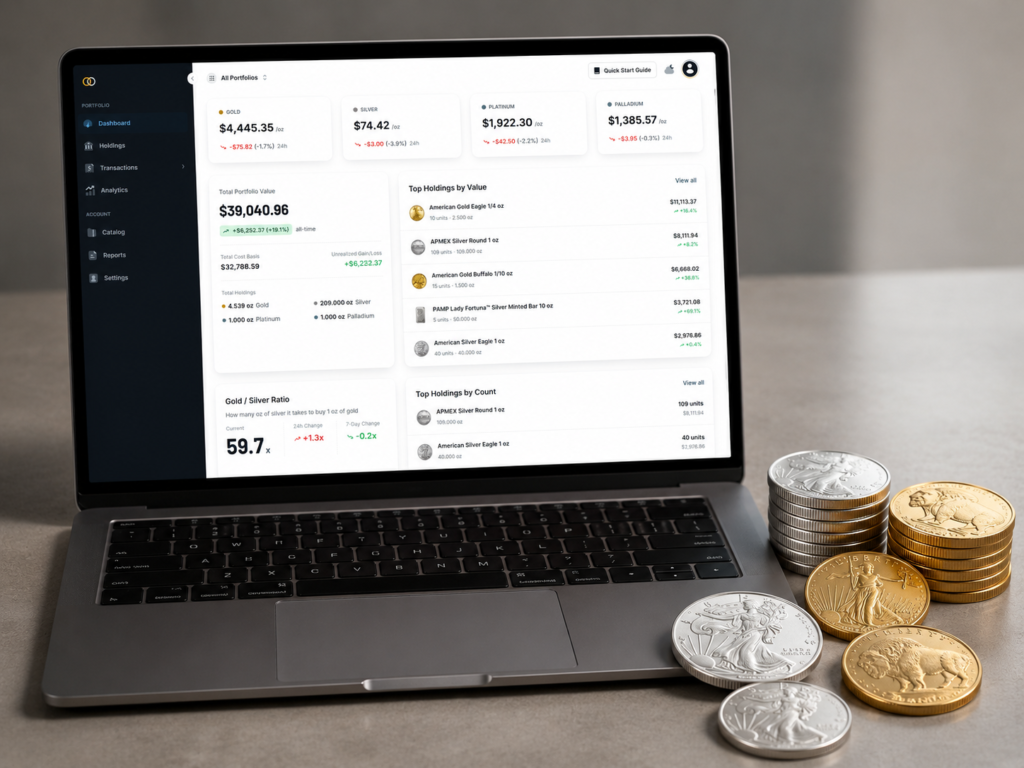
The Dashboard
The landing screen. A live spot ticker for all four metals across the top, the Total Portfolio Value card on the left (live total at current spot, with Total Cost Basis, Unrealized Gains, and Total Holdings by metal underneath), Top Holdings by Value and Top Holdings by Count on the right, and the gold-to-silver ratio in the bottom-left.
The number you glance at first thing in the morning. The Total Portfolio Value recalculates every time the spot ticker refreshes — about once a minute during market hours.
The Analytics page (Pro and Premium)
Performance over time. A Portfolio Value line chart with 1D, 1W, 1M, 3M, 1Y, and All-time range tabs — stepwise up at each purchase, smooth drift between purchases as spot moves. An Allocation by Value donut by metal. A Cost vs Current Value grouped bar chart per metal.
A Premium Analysis card with total dollars paid over spot and the average percentage per metal. A Holdings by Form table at full width, and By Dealer and By Size tables underneath. The screen where the slow-moving questions — am I drifting away from my target allocation, am I paying more in premiums than I used to — actually get answered.
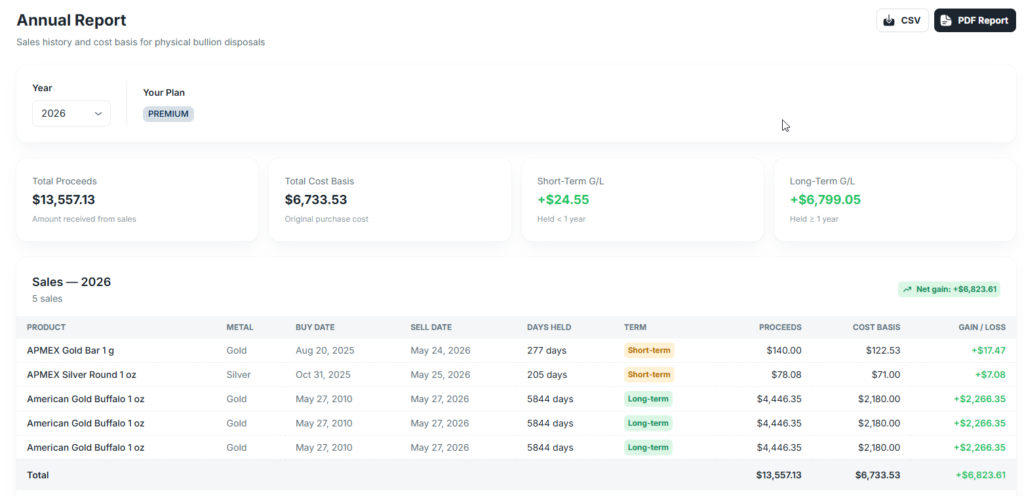
The Annual Report (Premium)
A US tax-ready report. A year selector, four headline cards (Total Proceeds, Total Cost Basis, Short-Term Gain or Loss for items held under 365 days, Long-Term Gain or Loss for items held 365 days or more), and a sales table with one row per sold item — Product, Metal, Buy Date, Sell Date, Days Held, a Short-term or Long-term chip, Proceeds, Cost Basis, and Gain/Loss. CSV and PDF export buttons sit at the top-right.
The cost basis method is Specific Identification, which is applied automatically because every sold item already links back to the specific purchase that created it. UK and Canada tax-report support is on the roadmap; the current Annual Report is US-only.
Organizing with multiple portfolios
A portfolio in the ledger is a container for transactions and the inventory items they create. Every coin lives inside exactly one portfolio.
The portfolio selector at the top-left of the app is global — switching pages does not reset it — and it scopes the Dashboard, the Holdings page, the Analytics page, the Record Sale picker, and the Annual Report to whichever portfolio is selected. An “All Portfolios” option rolls everything up.
Common reasons to split into more than one portfolio: personal holdings kept separate from a household or trust account, a long-term stack kept separate from a short-term trading position, or IRA-held metals kept separate from personally-held metals.
The default portfolio is created automatically at signup and cannot be deleted; new portfolios are added from Settings. Per-tier caps are 1 portfolio on Starter, 3 on Pro, and 10 on Premium.
Frequently asked questions
How do I track my gold and silver investments?
Keep an item-level inventory: one row per coin or bar with the product, purchase date, dealer, spot at the moment of purchase, the premium paid above spot, and a personal identifier. Update it at every buy and every sale. A spreadsheet works for a small portfolio; a purpose-built tracker handles live spot, premium history, and Specific Identification cost basis without the manual matching.
What’s the best app for tracking precious metals?
The best app for tracking precious metals is one built specifically for physical bullion — coins, bars, rounds, and junk silver — rather than a general portfolio app retrofitted to handle metals. Look for item-level inventory, premium-over-spot as a tracked field, locked-in historical spot on every purchase, live current value, multi-currency display, and a sales workflow that supports Specific Identification cost basis. Gold Silver Ledger is built around exactly those requirements.
Can I track precious metals in a spreadsheet?
Yes, for a small collection — a couple dozen pieces from one or two dealers, in a single currency, that you do not expect to sell. A spreadsheet handles purchase records and a simple cost basis column without much effort. The structural problems show up once any of live pricing, separated premium history, Specific Identification on sales, or cross-currency totals starts to matter — at which point a purpose-built tracker is easier than patching the sheet.
What information should I record for each coin or bar?
Record the product (name, mint or refiner, weight, purity, form), the purchase date, the dealer, the spot price at the moment of purchase, the premium paid above spot in dollars, any shipping cost allocated to the purchase, and a personal identifier — a nickname, a serial number, or the specific mint year on the coin. Item-level (one record per physical piece) beats summary-level (one row per product).
How do I track premium over spot on the coins I’ve bought?
Record the premium as a separate dollar amount on every purchase, alongside the spot price that applied at the moment of purchase — do not bury it inside a single “total price paid” cell.
Gold Silver Ledger’s Record Purchase form asks for premium per unit directly, then surfaces it on every holding, on the dashboard totals, and on the Premium Analysis card inside the Analytics page.
Does Gold Silver Ledger track ETFs, mining stocks, or paper gold?
No. The ledger is built for physical bullion only — coins, bars, rounds, and junk silver that you actually hold. Paper holdings, ETFs like GLD or SLV, mining shares, and unallocated metal accounts fit a brokerage app better. The help center summary line is the cleanest version: if your gold does not have a serial number or a coin tube, this is not the right tool.
Can I import an existing spreadsheet into Gold Silver Ledger?
Yes, on the Premium plan. Bulk CSV Upload accepts a spreadsheet of historical purchases and creates the transactions and inventory items in batch. Each CSV row becomes one purchase transaction; the quantity column becomes the number of inventory items created. Products match the built-in catalog by slug or are created as custom items on the fly. Validation is all-or-nothing — every row passes before any row imports.
Start tracking your metals with Gold Silver Ledger
Gold Silver Ledger gives you three views of every coin and bar you own — grouped by metal, flat and sortable, or laid out as a wall of product photos — plus search and filter across the whole inventory, optional per-item labels for the pieces you want to find again, and live cost basis and current value side by side on every row.
The difference compared to a spreadsheet is having a tool built around the way physical bullion actually moves through a collection, not one built around generic rows and columns.
Every monthly plan starts with a 14-day free trial. Payment is captured at signup, but no charge is taken until day 15, and you can cancel or change plans before then. All three plans include item-level tracking, live spot, premium tracking, cost basis, unrealized gains, and multi-currency display.
Pro adds the Analytics page and full-history CSV export; Premium adds the Bulk CSV Upload (handy for migrating an existing spreadsheet) and the tax-ready Annual Report. Start your free trial on the Gold Silver Ledger pricing page.
This article is for informational and educational purposes only. It is not financial, investment, legal, or tax advice. The Annual Report’s Short-Term and Long-Term gain figures follow US tax rules (the 365-day threshold) and use Specific Identification cost basis; consult a qualified tax professional about your specific situation.