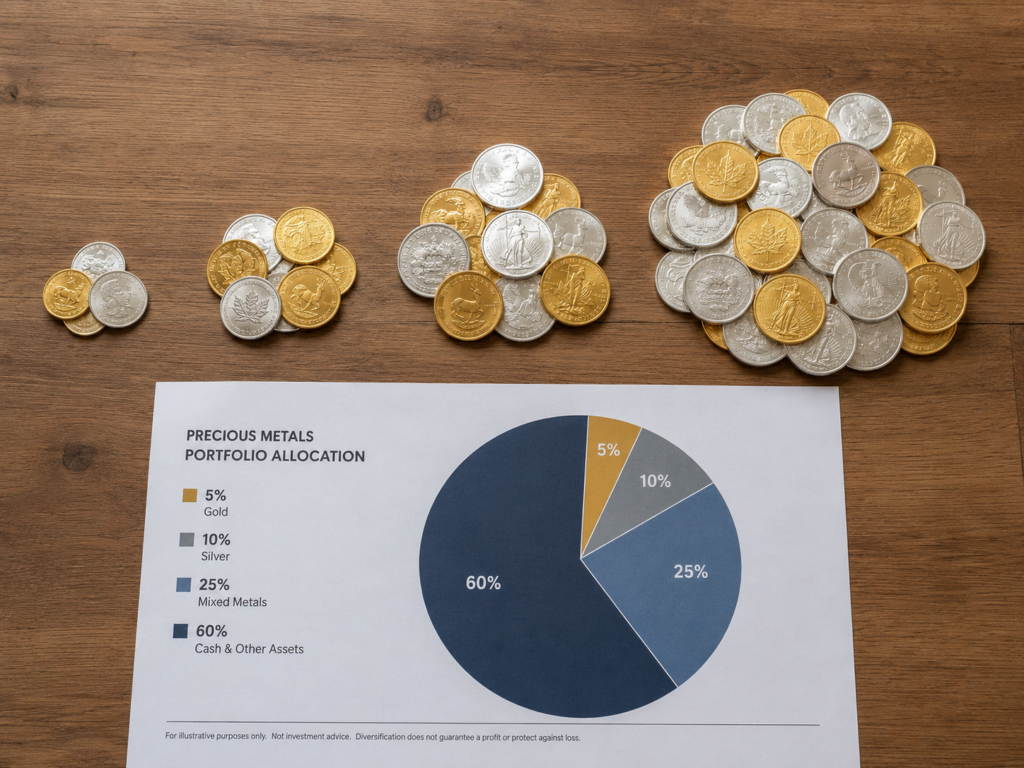
Most credible allocation research lands gold somewhere between 5% and 15% of a diversified portfolio, with three reference points that come up over and over: a 5% “insurance-sized” position, a 10% balanced diversifier, and a 25% allocation borrowed from Harry Browne’s Permanent Portfolio.
The honest answer to how much gold should I own is a range that depends on which framework you anchor to, what stage of life you are in, and what you actually count as “the portfolio” in the denominator.
This guide walks through the three frameworks, the life-stage adjustments, the math step most articles skip, and the gold-versus-silver split inside the allocation.
This article is for informational and educational purposes only and is not financial advice. The full disclaimer sits at the bottom of the page.
The three allocation frameworks
Three frameworks dominate the published research and the fee-only planner conversation. The 5% position comes out of the World Gold Council’s long-run portfolio simulations. The 10% position lines up with the gold portion of Ray Dalio’s All Weather framework. The 25% position is Harry Browne’s Permanent Portfolio. Each rests on a different premise about what role gold should play, and each fits a different reader.
The three allocation frameworks at a glance.
| Framework | Gold share | Other assets | Underlying logic | Best fit |
| World Gold Council research | 5–10% | Standard 60/40 (stocks + bonds) | Empirical Sharpe-ratio and drawdown improvement in long-run backtests | Diversifier-minded investors using a 60/40 base |
| Bridgewater All Weather | 7.5% gold + 7.5% commodities | 30% stocks, 40% long Treasuries, 15% intermediate Treasuries | Risk parity across four economic regimes | Investors who want regime balance, not just diversification |
| Browne Permanent Portfolio | 25% | 25% stocks, 25% long bonds, 25% cash | Four equal sleeves, each chosen to thrive in one of four regimes | Investors who want a complete four-asset system, not just a gold sleeve |
The 5% allocation (insurance-sized position)
Five percent is the level at which the World Gold Council’s 20-year portfolio research starts to show measurable improvements in Sharpe ratio and reductions in maximum drawdown for a standard 60/40 portfolio. Below 5%, the gold sleeve is too small to matter in a crisis year. Above 10% (the upper end of the WGC’s optimal range), the diversification gains start to flatten.
Fee-only financial planners who treat gold as an insurance line rather than a conviction holding tend to land here — large enough to soften a once-a-decade drawdown, small enough that long stretches of underperformance do not drag on the total.
The 10% allocation (balanced diversifier)
Ten percent sits roughly in the middle of the WGC’s 5–10% optimal range and lines up with the gold portion of Ray Dalio’s All Weather framework — 7.5% gold paired with 7.5% broad commodities, which puts the full real-asset sleeve at 15%. The other 85% is 30% equities, 40% long-term Treasuries, and 15% intermediate Treasuries, weighted by risk parity rather than by capital.
For investors who want gold to do real work in the portfolio but are not building the rest of the allocation around it, 10% is the most-cited benchmark in advisor commentary.
The 25% allocation (Permanent Portfolio)
Harry Browne’s Permanent Portfolio, introduced in 1981 and detailed in his 1999 book Fail-Safe Investing, allocates 25% to each of four assets: stocks, long-term Treasury bonds, gold, and cash. Each sleeve is chosen to thrive in one of four economic regimes — prosperity, deflation, inflation, and recession.
Published long-run backtests show the portfolio returning roughly 9.7% annualized from 1972 to 2020, with notably lower drawdowns than equity-heavy alternatives.
The honest caveat: from about 1980 to 2005, gold underperformed materially in real terms, and Permanent Portfolio investors had to sit through it. The 25% gold sleeve only makes sense as part of the full four-asset system; it is not a standalone recommendation.
How your allocation should change with life stage
The frameworks are starting points, not life-cycle plans. The right percentage drifts with time horizon, income concentration, and tolerance for sequence-of-returns risk. Two readers in the same household at different ages can sensibly run different numbers.
Early-career accumulator (20s–30s)
Long time horizon, high concentration in human capital (your salary is your biggest asset for the next 30 years), and a portfolio mostly composed of equities — often inside a 401(k). Gold’s role here is asymmetric: a small position with large optionality, primarily there to soften a once-a-decade drawdown that would otherwise compound badly on a small starting balance.
Most fee-only planners suggest 0–5% for this stage, and some say zero. The dollar amounts are small enough that storage and insurance frictions matter more than allocation percentage; many early in their career build the position slowly through dollar-cost averaging into the position rather than committing a lump sum.
Mid-career (40s–50s)
Peak earning years, the portfolio has scale, and lifetime expenses are clearer than they were a decade earlier. Gold’s role shifts toward portfolio-level diversification — 5–10% is the most common range, and mid-career readers most often settle on the 10% benchmark.
The tax bracket matters more now: a long-term gain on physical bullion lands under the collectibles rate explainer, and the dollar amounts in the position grow large enough that the gold-versus-silver split inside the precious-metals slice starts to matter.
Coverage and documentation also enter the picture — the insurance guide covers the homeowners’ sub-limit problem that surfaces once the portfolio passes a few thousand dollars.
Pre-retirement and retirement (60s+)
Sequence-of-returns risk dominates here. A drawdown in the first five years of retirement is much more damaging than the same drawdown twenty years in, because there is no future income to replace what was withdrawn at a low.
Many planners shift a 60/40 portfolio toward 50/50 or 40/60 as bonds grow into a larger share, and gold’s role becomes more explicitly defensive — hedging against an early-retirement drawdown and against an inflation regime that erodes the fixed-income sleeve.
Allocations of 10–15% are common; readers building a position inside a tax-advantaged structure can also look at the Gold IRA guide.
What “percent of portfolio” actually means
The math step most articles skip. Two things drive whether a number on paper matches what is actually in your accounts: the numerator and the denominator.
The numerator is the current market value of your gold and silver — spot price times weight in troy ounces, plus any numismatic premium for graded coins. It is not what you paid. If you bought at lower spot prices and watched the position appreciate, you may already sit at the target percentage without buying another ounce; if you bought near a peak, you may sit below the target even though the dollars went in.
The denominator is what counts as “the portfolio.” In most published research and planner commentary, it means investable assets — taxable brokerage accounts, retirement accounts, and cash equivalents, but not your primary residence.
Some frameworks use liquid net worth (broader) or total net worth, including the home (broader still). The 5%, 10%, and 25% framework numbers above all assume investable assets unless the underlying paper says otherwise.
Pick a denominator and use it consistently across every check; mixing definitions makes the percentage drift on paper without anything actually changing in the accounts.
How to split the precious metals slice (gold, silver, platinum)
The article title is about gold, but many people hold more than one metal. There is no canonical split inside the precious metals slice — the right mix depends on the role you expect each metal to play. Three patterns come up most often:
- All-gold (100% gold): Common among those using gold purely as a store of value or monetary hedge. Smaller dollar volume per ounce, lower premiums on a per-dollar basis, and the cleanest fit with the WGC and All Weather framework assumptions, which model gold specifically rather than a precious-metals basket.
- Mixed 70/30 or 60/40 gold-to-silver: The most-cited mixed split. Captures gold’s monetary-hedge role while adding silver’s industrial-demand exposure (solar, electronics, EV manufacturing) and lower per-ounce cost for people who like to buy in smaller increments. Common pattern in the silver stacking community.
- Silver-heavy (50/50 or higher silver share): Those who treat silver as both a store of value and a leveraged play on industrial demand. The trade-off is higher premiums per dollar of metal (especially on common-date Eagles and rounds) and more storage volume for the same dollar position. Best understood as a deliberate conviction tilt, not a default.
How Gold Silver Ledger shows your current allocation
An allocation target is hypothetical until you can see the current actual against it. Gold Silver Ledger keeps the precious metals slice of your portfolio current automatically as spot prices move, so the percentage in your holdings updates without you re-typing anything.
Two views matter most for this question — the donut on the Analytics page, and the time-range chart that shows how the percentage drifted to get there.
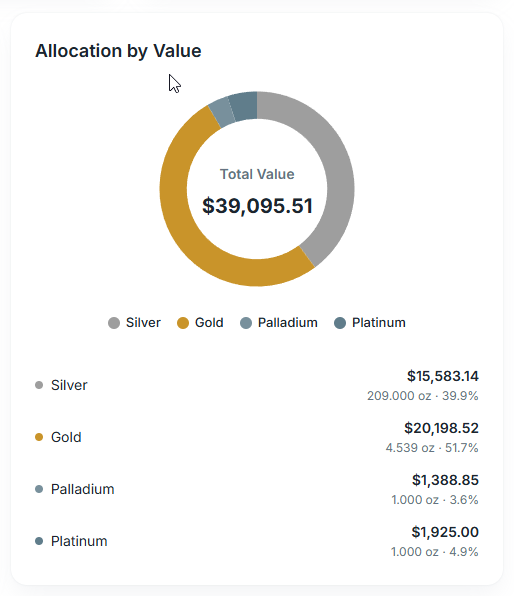
Allocation by Value (the donut)
On the Analytics page, the Allocation by Value donut chart breaks your current holdings down by metal — gold, silver, platinum, palladium — with the center showing total value and the legend listing each metal’s dollar value, weight, and percentage share. It answers the in-slice split question (how is your precious-metals allocation distributed across the four metals), not the across-portfolio question (how big is the precious-metals slice as a share of your total assets).
The app sees what you have entered into it; your brokerage, IRA, and cash holdings live elsewhere and have to be combined manually to compute the across-portfolio percentage. Analytics is on the Pro and Premium plans; the Starter plan shows totals by metal on the Holdings page, but does not include the donut.
When the number drifts (rebalancing context)
Even when you do not buy or sell, your allocation moves. A 10% target set last year can drift to 13% after a gold rally or to 7% after a pullback, simply because spot moved. The Analytics page’s Cost vs Current Value bar chart shows the gap that drives the drift, and the Portfolio Value chart’s time-range tabs (1D, 1W, 1M, 3M, 1Y, All) show how quickly that drift built up.
Acting on the drift — trimming the position back to target or topping it up — is its own decision with its own tax exposure on the sell side; the dedicated rebalancing guide covers when to act and how to think about the tax cost.
Common allocation mistakes
Five recurring mistakes show up in stacker forums and planner intake conversations. Each is fixable before the next round of buys.
Treating a single number as the answer
There is no universal “right” percentage. The WGC range, the All Weather sleeve, and the Permanent Portfolio’s 25% all rest on different premises. Pick the framework that matches your thinking, then pick the number from inside it.
Mixing numerator currencies
Valuing gold at cost basis when computing the percentage understates the slice. Use market value (spot × weight) consistently, the same way every other asset on the balance sheet is marked.
Shifting the denominator
Comparing one quarter’s number using investable assets to the next quarter using total net worth makes the percentage move for no real reason. Lock the denominator and use it every time.
Forgetting rebalancing exists
An allocation set once is not the same as an allocation maintained. Sustained drift past a chosen band (commonly ±2% or ±5% of the target) is the signal that the position needs attention.
Confusing in-slice split with across-portfolio share
Going “80% gold, 20% silver” inside the metals slice is a different decision from going “10% metals across the portfolio.” Both decisions exist; conflating them produces math nobody can act on.